ClickHouse disk alerts might be your logs, not your data
I kept resizing ClickHouse volumes because of disk alerts. Turns out the log tables were the ones eating the space, not the data.

I keep running into this 'logs taking up most of the reserved space' issue in almost every ClickHouse project I set up. Having worked with other databases like PostgreSQL and MySQL, when Grafana warns that the database disk usage hit a certain level, I first assume it is the actual data that was taking up that disk space. But with ClickHouse, the actual case might be different, and you might want to check the system log tables before increasing the database volume size.
It first happened years ago when I ditched Elasticsearch for ClickHouse for storing WebGazer's time series data. The persistent volume space I reserved for data got used up sooner than I planned. Then I increased the size. This kept happening: I’d get a disk threshold alert, then I’d increase the size. But the thing is, WebGazer has data retention checks in place, so the stale data is deleted regularly. And there wasn't a big jump in the number of monitors that would explain the disk bump. That's when I decided to investigate further.
I used this query to see which table takes how much space:
SELECT
  database,
  table,
  formatReadableSize(sum(data_compressed_bytes) AS size) AS compressed,
  formatReadableSize(sum(data_uncompressed_bytes) AS usize) AS uncompressed,
  round(usize / size, 2) AS compr_rate,
  sum(rows) AS rows,
  count() AS part_count
FROM system.parts
WHERE
  (active = 1)
  AND (database LIKE '%')
  AND (table LIKE '%')
GROUP BY database,
  table
ORDER BY size DESC;
ClickHouse query to get table sizes
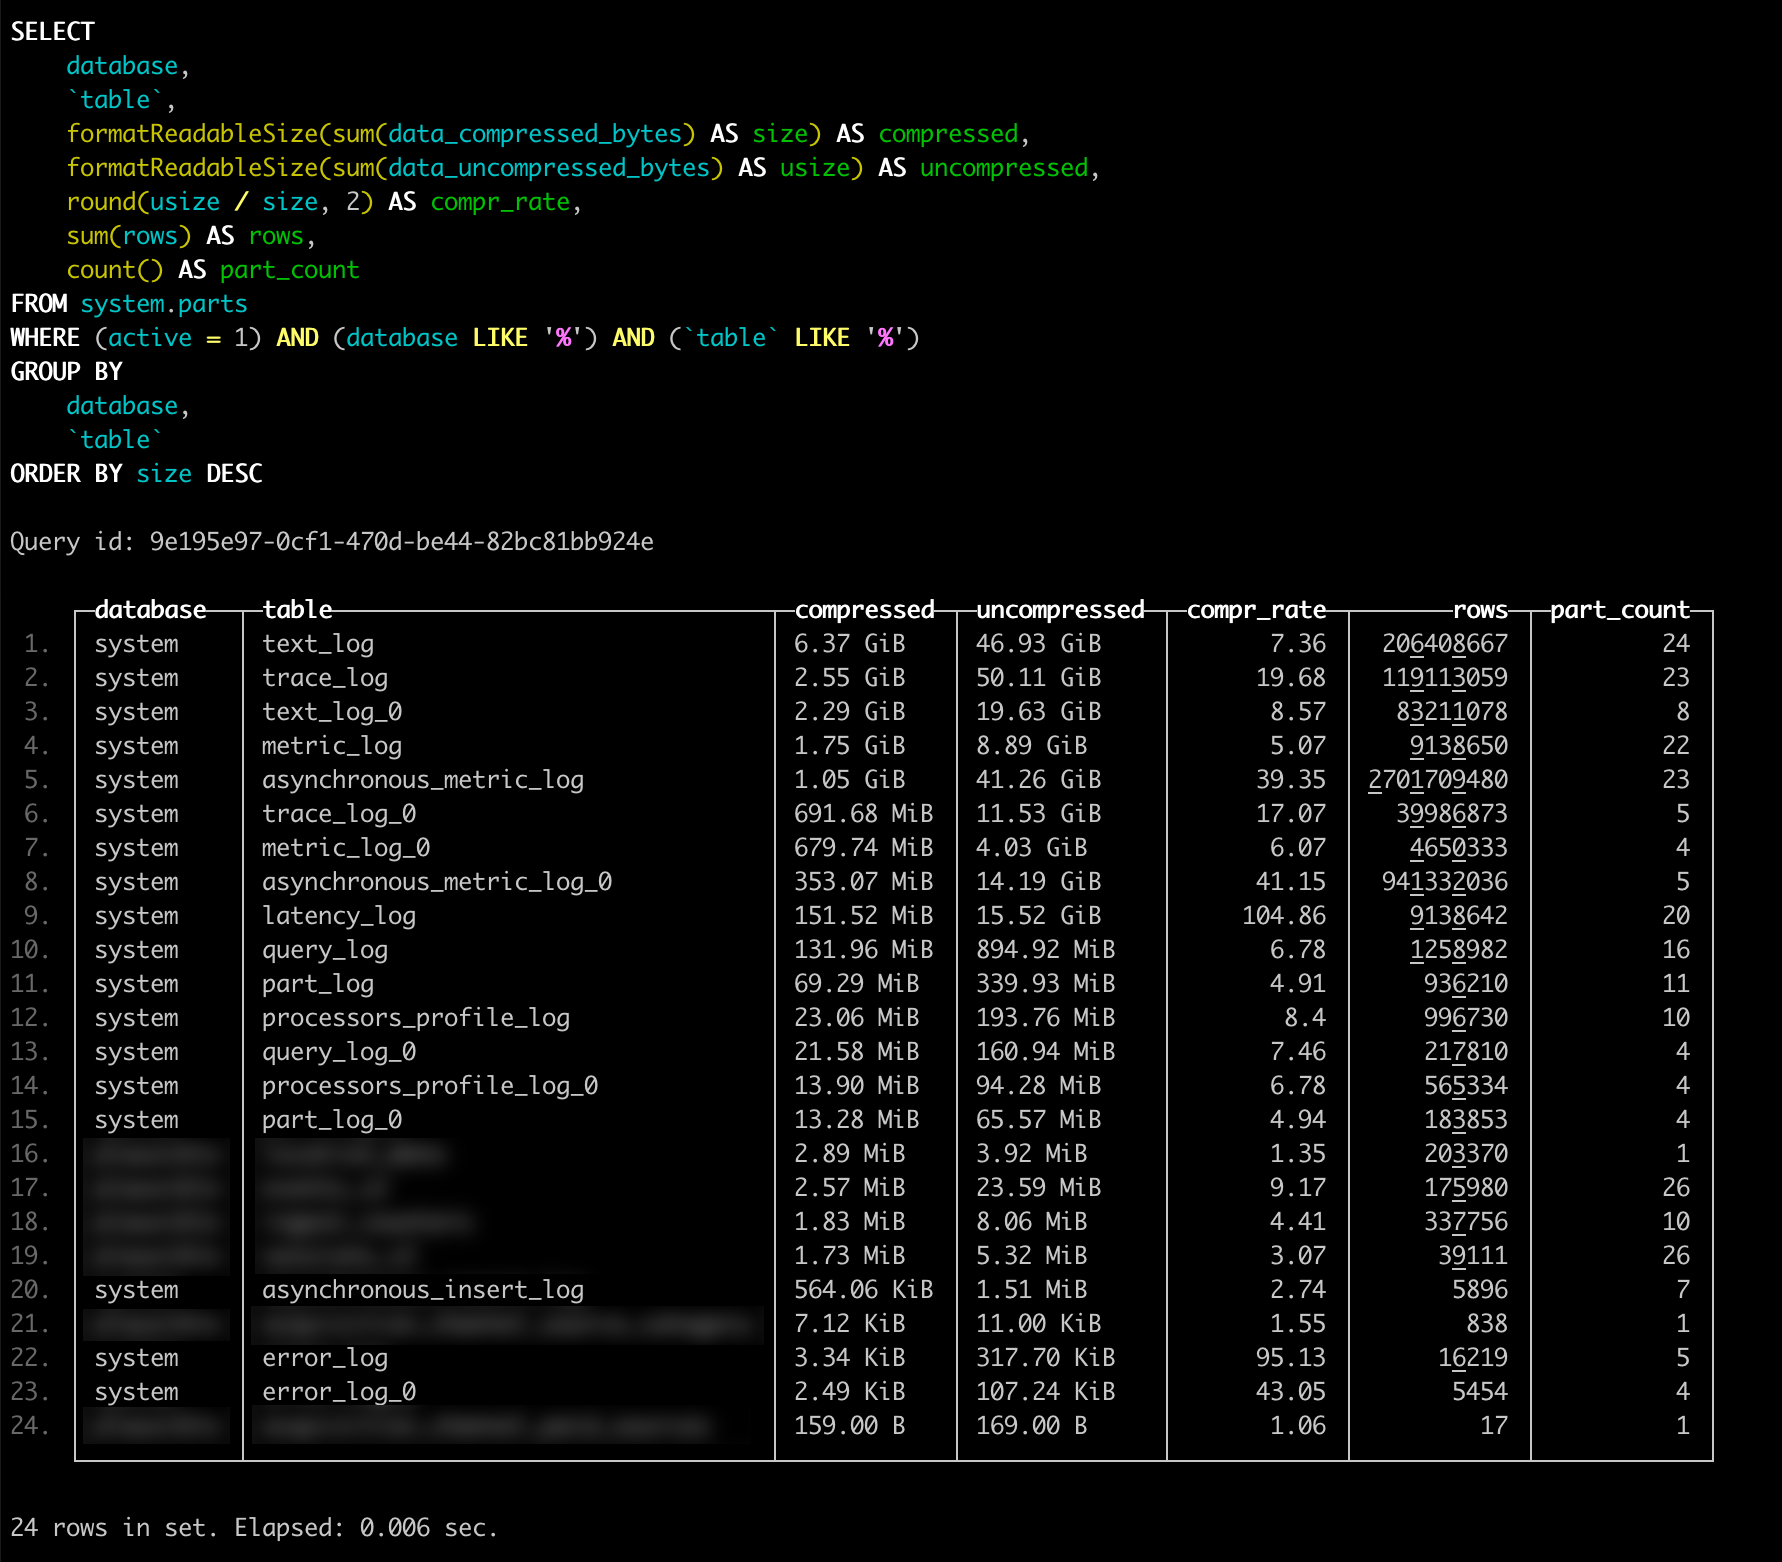
The result looked like this:

*_log tables taking most of the spaceI don't have the original WebGazer numbers. The screenshot below is from a recent internal project that finally pushed me to write this up. It is from a small internal project. As you can see, total size of tables that hold the actual data is around 9 MB, but the logs take around 16 GB of space. Well, I don't want ClickHouse to store those logs, because I have my own observability setup in place.
Disabling logging
ClickHouse has configuration option for enabling or disabling all these log types, for a full list, you can check the docs here. But this is the configuration I am using:
<?xml version="1.0"?>
<clickhouse>
  <asynchronous_insert_log remove="1" />
  <asynchronous_metric_log remove="1" />
  <crash_log remove="1" />
  <latency_log remove="1" />
  <metric_log remove="1" />
  <opentelemetry_span_log remove="1" />
  <part_log remove="1" />
  <processors_profile_log remove="1" />
  <query_log remove="1" />
  <query_thread_log remove="1" />
  <query_views_log remove="1" />
  <session_log remove="1" />
  <text_log remove="1" />
  <trace_log remove="1" />
  <zookeeper_log remove="1" />
</clickhouse>
You can put this file in the ClickHouse's config directory as /etc/clickhouse-server/config.d/disable-logging.xml (name of the file can be anything ending with .xml). You need to restart the ClickHouse server for config to take effect, and it will stop creating those log tables.
Deleting existing logs
Using that config will prevent ClickHouse from logging from now on. But if there are logs already, you also need to delete them. Fortunately, it is safe just to drop those tables. Even without disabling logging, you can drop the tables and ClickHouse will recreate them when it needs.
Depending on your configuration, you can have different tables, don't forget to check them with the query I wrote above for getting table sizes.
DROP TABLE text_log;
DROP TABLE trace_log;
DROP TABLE metric_log;
DROP TABLE asynchronous_metric_log;
DROP TABLE latency_log;
DROP TABLE query_log;
Query for dropping existing ClickHouse log tables
Saying it again, I disabled all of this logging because I already had the observability setup I needed. Before going full terminator mode and disabling all logging, take a minute to think about what you actually need. If you might want the logs later, a time to live (TTL) is probably a better fit.


